Table of Contents
Those days have gone by since companies used to do data analysis manually. With the introduction of free statistics software, it has been a great help to carry out the statistical analysis of the huge data. Students who are doing research or about to begin their research work or survey might find this blog post from AllAssignmentHelp.com interesting. Here we have listed the top 8 free statistics software programs of 2024 that can be used in academics. With this software, you can easily analyze your data outside of your university computer lab without having to pay a huge amount in subscription fees. Statistical software provides multiple benefits for students, like helping to create charts and graphs, report on data insights, and make better decisions. So with this blog, let us have a look at some of the useful software that you can use for your studies.
Top Free Statistics Software for Students
Statistics is an important subject in academics. Software statistics play an important role in student’s lives and help them effectively conduct research. It not only reduces long hours of work but also increases productivity and accuracy. There are many free statistical software programs available that students can use to report on their final project. A few of the free-to-use statistics software programs that students can use to support their research and test evidence are listed below.
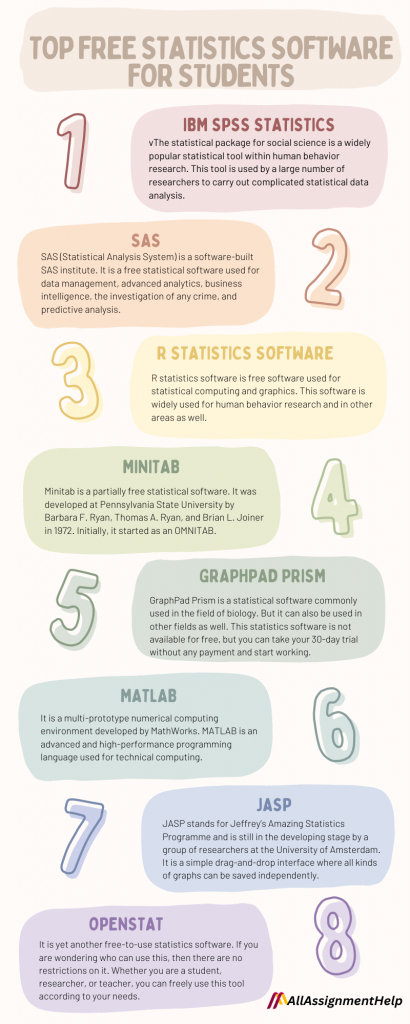
1- IBM SPSS Statistics
The statistical package for social science is a widely popular statistical tool within human behavior research. This tool is used by a large number of researchers to carry out complicated statistical data analysis. The purpose of creating this tool is to manage and do a statistical analysis of social science data. This software was manufactured by SPSS, Inc., in 1968. However, in 2009, it was acquired by IBM. Since 2015, it has been called IBM SPSS Statistics. SPSS is popular and widely used in the world due to its straightforward and English-like command language. Also, it has a detailed user manual that encourages the user to use this tool.
The SPSS tool has a wide range of uses. Healthcare researchers, market researchers, companies conducting surveys, marketing organizations, academic researchers, data miners, etc. use this tool for handling and analyzing data. Most companies around the globe prefer to get their hands on the SPSS tool for analyzing the data and data mining of the text to get the most appropriate result from the research projects.
In the education field, IBM SPSS statistical software facilitates effective teaching. It enables students to develop analytical skills and also helps in accurate research and decision-making. If you are planning to conduct marketing or any type of research, the SPSS campus edition will be of great help.
If you are compiling a project or working on the assignment of statistics and facing issues in analyzing the data, then reach out to online experts for assistance. Do you know that just by asking, please take my online statistics class for me? You can get help and submit assignments with proper interpretation of the data.
2- SAS Free Statistics Software
SAS (Statistical Analysis System) is a software-built SAS institute. It is a free statistical software used for data management, advanced analytics, business intelligence, the investigation of any crime, and predictive analysis. This free statistics software suite can alter, manage, mine, and retrieve data from several sources and perform statistical analysis on it. This software works on commands and performs statistical analysis and data visualization. SAS works on the Windows OS. It is used for industrial as well as academic purposes. SAS provides a large range of statistical methods to perform an advanced level of statistical analysis. It provides a high range of customizations for analysis and output options.
Students who are facing issues analyzing data through SAS for their homework can ask online writers, Can you do my statistics homework? With this request, you will get a good statistical analysis performed by the experts for the presented data.
3- R statistics software
R statistics software is free software used for statistical computing and graphics. This software is widely used for human behavior research and in other areas as well. R statistics software is a flexible tool that works fine on multiple operating systems, such as Windows, UNIX, and macOS.
This free statistical software has a great range of statistical and graphical techniques. R statistics software consists of classical statistical tests, linear and non-linear modeling, time series analysis, clustering, classification, and more. One can extend R with the help of various extensions and functions. You can easily alter R objects if you have good hands-on experience with Java,.NET, Python, C++, and C codes.
If you are using R or about to use this free software, then you must know that you can enter the data directly into R. However, most of the students or researchers prefer to use MS Excel to form a data set. Data sets consist of variables and subjects. A column represents the variable, and a row is used to represent the subject. MS Excel is a handy piece of software that helps with editing and entering data in R. One can save an Excel file in comma-delimited format’ or in.csv, and these files can be read through R software for statistics and data analysis. Visit R-Project.org to learn more about this software.
4- Minitab
Minitab is a partially free statistical software. It was developed at Pennsylvania State University by Barbara F. Ryan, Thomas A. Ryan, and Brian L. Joiner in 1972. Initially, it started as an OMNITAB 80. It was a light version of OMNITAB. This statistical software performs automated calculations and graph creation. This statistical software helps the user concentrate more on the data analysis and result interpretation. It is one of the easiest-to-use predictive analytics software.
Minitab has an advantage over other types of statistics software; it is easier to understand than R and SAS. Editing and creating graphs are quite easy. However, there is a small catch with this software: machine learning cannot be performed through it. Overall, it is the basic software for Six Sigma applications, and it is user-friendly as well. Though it is premium statistics software, a free trial version of this software is also available. Students can download it and use it for interpretation of the data. This is not entirely free statistics software; however, students can download a free trial version of this software to carry out the data analysis used in academics.
5- GraphPad Prism
GraphPad Prism is a statistical software commonly used in the field of biology. But it can also be used in other fields as well. This statistics software is not available for free, but you can take your 30-day trial without any payment and start working. GraphPad Prism is also offering free licenses to students to use this software in their courses. By enrolling in their course, you will automatically get access to this free statistics software, and this subscription lasts until course completion. Once your course is complete, your license will expire.
Free statistics software like SPSS also works by generating automated statistical analysis of the data. The GraphPad prism allows us to perform fundamental statistics that often come into use in laboratories or clinical research. GraphPad Prism is a 2D graphing and statistical software that can perform its functions on Macintosh and Windows. It is beneficial for beginners as it provides statistical guidance. Analysis checklists for prisms check whether an appropriate analysis was performed or not. This software offers endless ways to customize your graphs and structure them as per your needs.
6- MATLAB
It is a multi-prototype numerical computing environment developed by MathWorks. MATLAB is an advanced and high-performance programming language used for technical computing. It combines computation, programming, and visualization in an easy-to-use environment. MATLAB presents problems and solutions in well-known mathematical symbols. The following are the uses of Matlab:
- Data analysis, exploration, and visualization
- Math and computation
- Scientific and engineering graphics
- Application development, including graphic user interface building
- Algorithm development
- Modeling, simulation, and prototyping
MATLAB stands for matrix laboratory. Its inception was to provide access to matrix software developed by the LINPACK and EISPACK projects. MATLAB has transformed with the help of the input provided by various users. In academics and universities, it is common software to use in introductory and advanced-level courses in mathematics, science, and engineering. For industrial use, MATLAB provides high-quality and productive research and analysis. If we talk about whether MATLAB is free statistics software for students or not, then no, it is not free to use. However, more than 2,200 schools have provided campus-wide licenses to their students to use this statistical software for free. You can also obtain a license by creating a MathWorks account and using it for educational purposes.
7- JASP Free Statistics Software
JASP stands for Jeffrey’s Amazing Statistics Programme and is still in the developing stage by a group of researchers at the University of Amsterdam. It is a simple drag-and-drop interface where all kinds of graphs can be saved independently. This is one of the best free statistics software that is supported on Windows, Mac OS X, and Linux. JASP download is available for free of cost.
JASP is a free statistics software that has introduced a new way to do statistics. Jeffrey’s Amazing Statistics Programme is software that can read the following document formats:
- .csv
- .txt
- .tsv
- .ods
- .dta
- .sav
- .zsav
- .por
- .sas7bdat
- .sas7bcat
- .xpt
8- OpenStat
It is yet another free-to-use statistics software. If you are wondering who can use this, then there are no restrictions on it. Whether you are a student, researcher, or teacher, you can freely use this tool according to your needs.
This is a free version of 11.9.08 for platforms like Windows 98 SE. As per the developer, this tool is not a finished product, and if you are thinking of using this software, then you should do it at your own risk. As a student, after using this software, it is recommended to check the final results through other premium or paid statistical software for accurate results.
Battling to Complete Statistics Assignments Using Free Statistics Software? Get Top Quality Assistance From Us
Dealing with statistics assignments gets tricky at times, as there are topics that become difficult to understand. Most of the time, students fail to decipher the statistical data. But now you don’t need to worry about anything related to statistics. All Assignment Help is here to take away all your woes concerning statistics. We have got your back. Students can visit our main website and get statistics homework help on all topics and areas of statistics. We have expert writers for statistics from the US. They have expertise in working on all types of statistical software. You will get 100 percent precision in statistical analysis with the help of our experts. Here are the topics we cover while helping you with statistics assignments.
- Hypothesis testing
- Quantitative analysis
- Multivariate statistics
- Biostatistics
- Advanced probability theory
- Descriptive statistics
- MegaStat
- Probability distributions
- Regression analysis
- MATLAB
- MINITAB
- Reliability theory
- Linear programming
- SPSS
- Percentiles and quartiles
- Binomial distribution
- Coefficient of variance
- Sampling theory
- Vital statistics
- Hypothesis testing
There are plenty more topics that we cover under statistics that you can take advantage of as well. Moreover, the use of statistics is not only for social science; the subject also has its roots in mathematics. Therefore, if you are failing to achieve good grades in math, it’s time to ask for our help. You can get math homework help from our expert mathematicians to get quick and correct solutions.
Don’t Know How to Use Free Statistics Software? Hire Us and Receive the Best Statistics Assignment
It is not uncommon to have an odd time reading and analyzing the data that you have collected. Due to inefficiency or a lack of skills, you may face issues when working on different statistical tools. But at All Assignment Help, we have experts with great skills and knowledge of the tools used for statistical analysis. We can generate excellent results for you if you opt for our statistics assignment help.
- We have hired statistics writers who have experience and knowledge of tools such as MINITAB, SPSS, ANOVA, SAS, R, GraphPad Prism, etc.
- Statistics assignments require reports as well. Our professional experts can provide you with excellent reports and explanatory notes for statistics assignments.
- A correct interpretation of data is what students need while making the assignment of statistics. Our professional and experienced writers will never miss out on this point. They compile the perfect report by analyzing the data with precision. You will certainly receive a flawless assignment of statistics.
We work diligently on every student’s assignment. Unhesitantly, you can rely on our services, and our writers will provide you with the best work to boost your academic grades.
Frequently Asked Questions
| Question 1: Which is the best and easiest to use statistical analytical software? IBM SPSS Statistics software is the best software for statistical analytics. It is suitable for both higher education and research purposes. |
| Question 2: Which statistical analysis software is best for programming? Stata statistics software is best for advanced programming. There is no trial available for this tool. A premium subscription starts at $840 per year. |
| Question 3: Can EXCEL perform statistical data analysis? MS Excel offers an opportunity to present the data compellingly with the help of charts, graphs, and tables. This tool helps with statistical data analysis. It offers a wide range of tools for performing simple statistical analysis. |
| Question 4: Which software is best for graphing and visualization? Desmos, Plotly, Venn Diagram Plotter, Venny, VUE (Visual Understanding Environment), and yEd Graph Editor are a few of the best tools. |