
Table of Contents
In accounting, ratio analysis is a method that helps companies gain insight into their liquidity, profitability, and operational efficiency by comparing financial data and information in their financial statements. Ratio analysis stands as the cornerstone of a company’s fundamental analysis. Companies use this analysis to evaluate relationships among the items in their financial statements (Delen, Kuzey, & Uyar, 2013). However, these ratios are also used for identifying a company’s profitability, liquidity, and solvency trends over time or for comparing two or more companies at the same point in time. The current blog is constructed to provide a complete tutorial on ratio analysis.
Whether you are an accounting student or in any other related field, you should know everything about ratio analysis, as it will help you determine the financial health of the business. Refer to this blog post from AllAssignmentHelp.com and learn in detail about this ratio analysis.
What is Ratio Analysis?
Ratio analysis is conducted by considering a company’s financial statement and focusing on three major aspects, such as profitability, liquidity, and solvency. These ratios help potential shareholders or investors gauge a company’s financial performance over a certain period by comparing its financial performance with another company before finalizing investment decisions (Babalola & Abiola, 2013). Now, outside business analysts use different types of financial ratios for assessing companies, whereas insiders of a corporation rely less on these ratios because they have access to more detailed operational and financial data about their company.
However, this analysis involves evaluating a company’s financial performance and health by using the financial data available in its historical and current financial statements. Sometimes, this analysis is used to establish a trend line based on a company’s financial results over several financial years, i.e., reporting periods.
What Are the Uses of Ratio Analysis?
By now, we have provided an introduction to ratio analysis. Let us now move forward to understand the uses of this analysis in business.
- it is employed to assess a company’s financial standing with other companies in the sector.
- Ratio analysis is a term that helps understand a company’s position in the market.
- It helps to understand the current trend in financial performance. This can be useful in predicting the future course of financial achievement.
- Financial ratio analysis is a crucial tool for businesses to evaluate the management of their assets and liabilities.
- Competitive analysis is an important factor that helps a company stay steady in the long run. Ratio analysis is one term by which one can effectively perform competitive analysis.
- This method evaluates the management of assets and liabilities to determine if they are being utilized excessively or insufficiently.
These are a few common uses of ratio analysis in business. If you have any difficulty understanding your concept of online, you can anytime pay for online class help and easily hire expert online tutors for your assistance. With their assistance, you can learn in detail about ratio analysis, how it works, and all the other factors.
Limitations of Ratio Analysis
There is no doubt that ratio analysis is a popular technique of financial analysis that helps in deriving all the vital information of a business, which will help it stay in the market for the long run. However, like any other financial analysis technique in business, this too has some limitations that affect the financial statement. It is essential to know these limitations to avoid any issues.
Following are some of the known limitations of ratio analysis.
- The major limitation of this analysis is that its information does not relate to current events, and the companies cannot directly use it for their financial transactions.
- The data utilized in the research is based on actual historical performance; it does not forecast the success of the organization going forward.
- The ratio analysis does not display the periodic changes in prices due to inflation. Hence, it becomes difficult for companies to use these numbers for their financial statements.
- The ratio analysis is prepared using the information provided in the company’s financial statements. Any manipulation in the financial statement provided by the business can change the overall financial analysis of the business. All this information can mislead shareholders and external parties of the business into making the right decision.
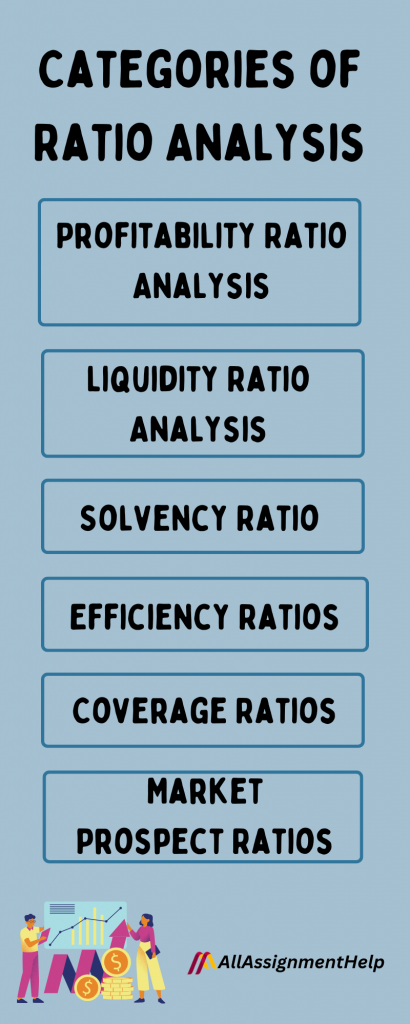
Different Categories of Ratio Analysis
Ratio analysis utilizes various financial analysis categories, including major financial ratios and formulas, to analyze financial data.
Profitability Ratio Analysis
Profitability ratios are financial metrics used by investors and analysts to assess a company’s ability to generate profit based on its revenue, operating costs, shareholders’ equity, and balance sheet assets. Also, these ratios show how well an organization uses its assets to produce profit as well as value for its shareholders. Profitability ratios are divided into margin ratios and return ratios.
The following are different profitability ratio formulas:
- Gross Profit Ratio = Gross Profit/Net Revenue of Operations × 100
- Operating Ratio = (Cost of Revenue from Operations + Operating Expenses)/ Net Revenue from Operations ×100
- EBITDA margin = EBITDA / Revenue
- Net Profit Ratio = Net Profit after tax ÷ Net sales
- Dividend Payout Ratio (DPR): Dividends per share / Earnings per share
- P/E Ratio = Market value per share ÷ Earnings per share
- Book Value per Share = (Shareholders’ Equity minus Preferred Equity) / Total Outstanding Common Shares
- Earnings per share = Net Profit ÷ Total no. of shares outstanding
- Return on Shareholders’ Fund = Profit after Tax / Shareholders’ Funds × 100
- ROCE or ROI = EBIT ÷ Capital Employed × 100
Margin ratios
This category of profitability ratios includes:
- i) gross profit margin, which compares a company’s gross profit from the business to its sales revenue. It shows a business’s earnings by taking the required costs of production into account.
- ii) Operating profit margin, which looks at a company’s earnings (operating profit) as a percentage of sales before deducting income taxes and interest expenses.
- iii) However, net profit margin is the most vital profitability ratio that looks at the net income (after deducting taxes and interest from operating profit) of a company, compares it to total revenue, and provides a final picture of a company’s profitability.
- iv) EBITDA (Earnings Before Interest, Taxes, Depreciation, and Amortization) is the margin that represents a company’s profitability before taking non-operating elements like interest, taxes, and non-cash items such as amortization and depreciation into account.
- v) Cash flow margin is used to express the relationship between a company’s sales and the cash flows it generates from its operating activities. Also, this ratio measures a company’s ability to convert its sales into liquid cash. However, the higher this ratio, the more cash available to a company from sales. They can use to pay dividends, suppliers’ dues, utilities, service debt, and to purchase capital assets (corporatefinanceinstitute.com, 2020).
Read also: What is the major objective of managerial accounting?
Return ratios
To tackle a finance assignment involving accounting financial ratios, one must be proficient in basic concepts. If not they can seek professional finance assignment help from assignment writers. A well-written assignment will help you understand more about financial concepts.
- i) ROA (return on assets), which represents the percentage of a company’s net income relative to its total assets and reveals how much profit (after-tax profit) a company uses to generate for every single dollar of assets it holds. Also, it measures a company’s asset intensity.
- ii) ROE (return on equity), which is used to express the percentage of a company’s net profit relative to its stockholders’ equity or the percentage of return equity investors can get on the money they have invested in a company. Investors and stock analysts focus on this ratio.
- iii) ROIC (return on invested capital), which measures the return generated by a company compared to the capital raised from shareholders and bondholders it has invested in its business (corporatefinanceinstitute.com, 2020).
Liquidity Ratio Analysis
These ratios measure a company’s ability to pay off its short-term financial obligations or debts and to meet its unexpected cash requirements. Accordingly, the analysis of liquidity ratios is very important for creditors and lenders who want to get some ideas regarding a company’s financial condition before granting credit to it. The most commonly used liquidity ratios are the current ratio, quick ratio, and working capital ratio. Also, the current ratio represents the ability of a company to meet its short-term debt or financial obligations and measures whether the company holds enough resources that it can use to repay its debts in the next twelve months.
The quick ratio measures the ability of a company to meet all its short-term financial obligations by using liquid assets (cash or quickly convertible assets) it holds. Consequently, it tells about the short-term debts of a company that it can repay by selling its liquid assets at short notice to the creditors. However, the working capital ratio is used to measure a company’s capability to meet its current financial obligations and how many liquid assets are available in a company’s hands (Brigham & Ehrhardt, 2013).
The following are liquidity ratio analysis formulas:
- Current ratio = Current Assets / Current Liabilities
- Quick Ratio = (Cash + Marketable securities + Accounts receivable) / Current liabilities
- Net Working Capital Ratio = Current Assets – Current Liabilities
- Cash ratio = Cash and equivalent / Current liabilities
Solvency Ratio
The solvency ratio measures a company’s ability to meet its long-term debts. Moreover, it quantifies a company’s size after its tax income without counting its non-cash expenses for depreciation. It indicates a company’s solvency by judging its financial health. Common solvency ratios including debt-to-equity, debt-to-asset, and debt-to-capital are used to assess a company’s solvency.
The debt-to-equity ratio indicates the relative proportion of debts and shareholders’ equity a company uses to finance its assets. The debt-to-assets ratio indicates the financial leverage of a company. It indicates how much of the total assets of a company were purchased or financed by its creditors. The debt-to-capital ratio measures the financial leverage of a company. The calculation involves dividing interest-bearing debt by the company’s total capital, including shareholders’ equity, to determine its short-term and long-term liabilities.
The following are solvency ratio analysis formulas:
- Debt to equity ratio = Long-term debt/shareholder’s funds
- Debt Ratio = Long Term Debt / Capital or Debt Ratio = Long Term Debt / Net Assets
- Equity Ratio = Shareholder’s funds / Capital or Shareholder’s funds / Total Assets
Efficiency Ratios
These ratios measure the capability of a company to utilize its assets as well as to manage its corporate liabilities effectively in a short-term period or for the current financial period. Some of the most common efficiency ratios are inventory turnover ratio, which indicates the movement or utilization of inventory. Account turnover ratio, which indicates how fast a company collects its dues from its customers. The asset turnover ratio is a financial measure that compares an organization’s revenue or sales to the value of its assets.
This ratio acts as an indicator of a company’s efficiency in using assets for revenue generation purposes. A higher asset turnover ratio indicates greater efficiency for a company. The accounted payables turnover ratio is an efficiency ratio that gauges a company’s speed in repaying its trade suppliers. It indicates a company’s financial condition by indicating the speed of the company’s activity to repay dues (Babalola & Abiola, 2013).
Efficiency ratio analysis formulas:
- Efficiency Ratio = (Operating Expenses ÷ Net Operating Income) × 100
- Operating efficiency or operating ratio = expenses (operating expenses, or OPEX + cost of goods sold, or COGS)/net sales
- Accounts receivable turnover ratio = net sales/average accounts receivable
- Average collection period = days in the period the company wants to track/accounts receivable turnover ratio during that period
- Accounts payable turnover ratio = total supply or other purchases/average accounts payable
- Average number of days payables outstanding = days in period to track/accounts receivable turnover ratio during that period
- Inventory turnover ratio = cost of goods sold/average inventory
- Days sales in inventory = (average inventory/cost of goods sold) X 365
- Asset turnover ratio = net sales/average total assets
- Fixed asset turnover ratio = net sales/average fixed assets
- Total assets to sales = total assets/sales
- Fixed assets to total assets = fixed assets/total assets
- Working capital ratio = current assets/current liabilities
Coverage Ratios
A coverage ratio shows how well-equipped the business is to fulfill all of its obligations without having to compromise on its financial stability. If a company has a higher ratio, it means that it can easily pay off its business liabilities and debt. Interest coverage, debt service coverage, asset coverage, and cash coverage are the different types of coverage.
The shareholders and other third parties use this ratio to decide whether the company is financially stable or not, and it also helps them decide whether they can invest in it or not.
The following are coverage ratio analysis formulas:
- Interest coverage ratio = EBIT / interest on long-term debt
- Debt Service Coverage= Operating Income / Total Debt
- Asset Coverage = (Tangible Asset – Short Term Liabilities)/Total Debt
- Cash Coverage = (EBIT + Non-Cash Expense)/Interest Expense
Market Prospect Ratios
The market-prospect ratio is a ratio that helps in predicting the future returns of the business. It helps them know how much they will earn from specific investments. Earnings per share, price-earnings ratio, dividend payout ratio, and dividend yield are the basic market ratios that investors tend to analyze.
The following are market prospect ratio analysis formulas:
- Earnings Per Share = Net Income – preferred dividends / Weighed Average Common Shares Outstanding
- P/E Ratio = Market Value per Share / Earnings per Share
- Dividend Payout Ratio = Total Dividends / Net Income
- Dividend Yield Ratio = Cash Dividends per share/Market Value per share
Also Read: Detailed SWOT Analysis of Apple Computers
Top Ratio Analysis Example
Different types of possible ratios can be used for analysis purposes. However, there is only a small core group that is used to gain an understanding of an entity.
Such ratios include the following:
- Current Ratio: These types of ratios are used to compare the current assets to the current liabilities. This happens to determine whether a business has enough cash to pay its immediate liabilities.
- Days Sales Outstanding: These types of ratios are used to determine the ability of a business to effectively issue credit to its customers and also to be paid back within a given period.
- Debt-to-Equity Ratio: This usually compares the proportion of debt to equity to see if a business has taken on too much debt.
- Dividend Payout Ratio: This is usually the percentage of earnings that are paid to investors in the form of dividends. If the percentage is low, then it will be an indicator that there is no room left for the dividend payments that could increase sustainability.
- Gross Profit Ratio: It is a financial measure used to determine the proportion of earnings generated from the sale of goods or services before accounting for administrative expenses.
- Inventory Turnover: This is used to calculate the time it takes to sell the inventory. A low turnover may indicate that a business has made an excessive investment in inventory and is therefore at risk of having obsolete inventory.
- Net-Profit Ratio: This is used to calculate the proportion of net profit to sales. A low proportion can indicate a bloated cost structure or pricing pressure.
- Price-earning ratio: This measures how much a company’s reported earnings are worth in relation to the price of its shares.
- Return on assets: This is used to calculate the ability of management to efficiently use assets that could generate profits.
About Us
Do you know that you can ease all your worries about accounting classes by asking us, Can I pay you to take my online accounting class for me? Yes, our professional accounting helpers can timely assist with all your online class requirements and make sure you score either an A or B. The following are some of the areas where we can assist you:
- Financial Accounting
- Tax Accounting
- Managerial Accounting
- Forensic Accounting
- Cost Accounting
- Auditing
- Governmental Accounting
- International Accounting
Also Read: Detailed PESTLE Analysis of Apple Computers
Conclusion
This blog post is fully equipped with the key financial ratios used by business analysts, investors, and other stakeholders. It will gauge a company’s financial performance for the current year or a certain period. Financial ratio analysis guides investors in selecting the most profitable company to invest in and helps creditors and other loan-providing organizations. It helps them decide whether it is profitable for them to grant loans to a company or not. Overall, analysis of financial ratios helps understand a company’s financial statements, identify trends over the years, and measure its actual financial state.
A thorough knowledge of ratio analysis is required for your assignment. If you lack the required knowledge, seek financial accounting assignment help and solve all your worries. Professional assignment writers have good knowledge of the subject and can produce the best assignments, which will increase your academic grades and subjective knowledge at the same time.
Frequently Asked Questions
| What is current ratio analysis? The current ratio is also known as the liquidity ratio. It refers to the fact that a company’s ability to pay all of its short-term obligations within one year or less. |
| What are the four main types of financial ratios used in ratio analysis? Liquidity ratios, activity ratios, profitability ratios, and leverage ratios are the four types of financial ratios. |
| What are the different types of ratio analysis? There are mainly five broad categories of ratios, liquidity ratios, solvency ratios, profitability ratios, efficiency ratios, and coverage ratios. |